TFL Bikes Data Analysis

Load data
url <- "https://data.london.gov.uk/download/number-bicycle-hires/ac29363e-e0cb-47cc-a97a-e216d900a6b0/tfl-daily-cycle-hires.xlsx"

# Download TFL data to temporary file
httr::GET(url, write_disk(bike.temp <- tempfile(fileext = ".xlsx")))
## Response [https://airdrive-secure.s3-eu-west-1.amazonaws.com/london/dataset/number-bicycle-hires/2022-09-06T12%3A41%3A48/tfl-daily-cycle-hires.xlsx?X-Amz-Algorithm=AWS4-HMAC-SHA256&X-Amz-Credential=AKIAJJDIMAIVZJDICKHA%2F20220914%2Feu-west-1%2Fs3%2Faws4_request&X-Amz-Date=20220914T154529Z&X-Amz-Expires=300&X-Amz-Signature=e424868a884444b16b15a86b5338a194108d68c5b9ae75394e645355957c4bb7&X-Amz-SignedHeaders=host]
## Date: 2022-09-14 15:45
## Status: 200
## Content-Type: application/vnd.openxmlformats-officedocument.spreadsheetml.sheet
## Size: 180 kB
## <ON DISK> C:\Users\ISHAAN\AppData\Local\Temp\Rtmp4INO7C\file37007f6471d1.xlsx# Use read_excel to read it as dataframe
bike0 <- read_excel(bike.temp,
sheet = "Data",
range = cell_cols("A:B"))
# change dates to get year, month, and week
bike <- bike0 %>%
clean_names() %>%
rename (bikes_hired = number_of_bicycle_hires) %>%
mutate (year = year(day),
month = lubridate::month(day, label = TRUE),
week = isoweek(day))Monthly changes in TFL Bike rentals
bike2 <- bike %>%
  filter(year>2015) %>%
  group_by(month,year) %>%
  mutate(month=match(month,month.abb)) %>%
  summarize(monthly_mean = mean(bikes_hired))
  #mutate(lag_mean = lag(monthly_mean))

bike_2016_to_2019 <-bike %>%
    filter(2015<year & year<2020) %>%
    group_by(month) %>%
    mutate(month=match(month,month.abb)) %>%
    summarize(monthly_mean_2016_2019 = mean(bikes_hired))

bike_merged<-merge(x=bike2,y=bike_2016_to_2019,by="month") %>%
  filter(year>2016)

bike_longer<-bike_merged %>%
              pivot_longer(cols=3:4,
                           names_to="type",
                           values_to="n")


ggplot(data=bike_merged, aes(x=month)) +

  geom_line(aes(y=monthly_mean)) +
  geom_line(aes(y=monthly_mean_2016_2019), colour='blue',size=1) +
  geom_ribbon(aes(x=month,
                   ymin = monthly_mean,
                   ymax = pmax(monthly_mean,monthly_mean_2016_2019),
                   fill = "red"),
                   alpha=0.1) +
  geom_ribbon(aes(x=month,
                   ymin = monthly_mean_2016_2019,
                   ymax = pmax(monthly_mean,monthly_mean_2016_2019),
                   fill = "green"),
                   alpha=0.1) +

    scale_x_continuous(breaks = seq_along(month.abb),
                        labels = month.abb) +

    scale_fill_manual(values=c("green", "red"), name="fill") +

    guides(linetype = "none", fill = "none") +
    labs(title = "Monthly changes in Tfl bike rentals", subtitle = "Change from monthly average shown in blue and calculated between 2016-2019",
         x='', y='Bike Rentals', caption = "Source: Tfl, London, Data Store") +

    theme(legend.position = 'none') +
    facet_wrap(~year)+
    theme_minimal()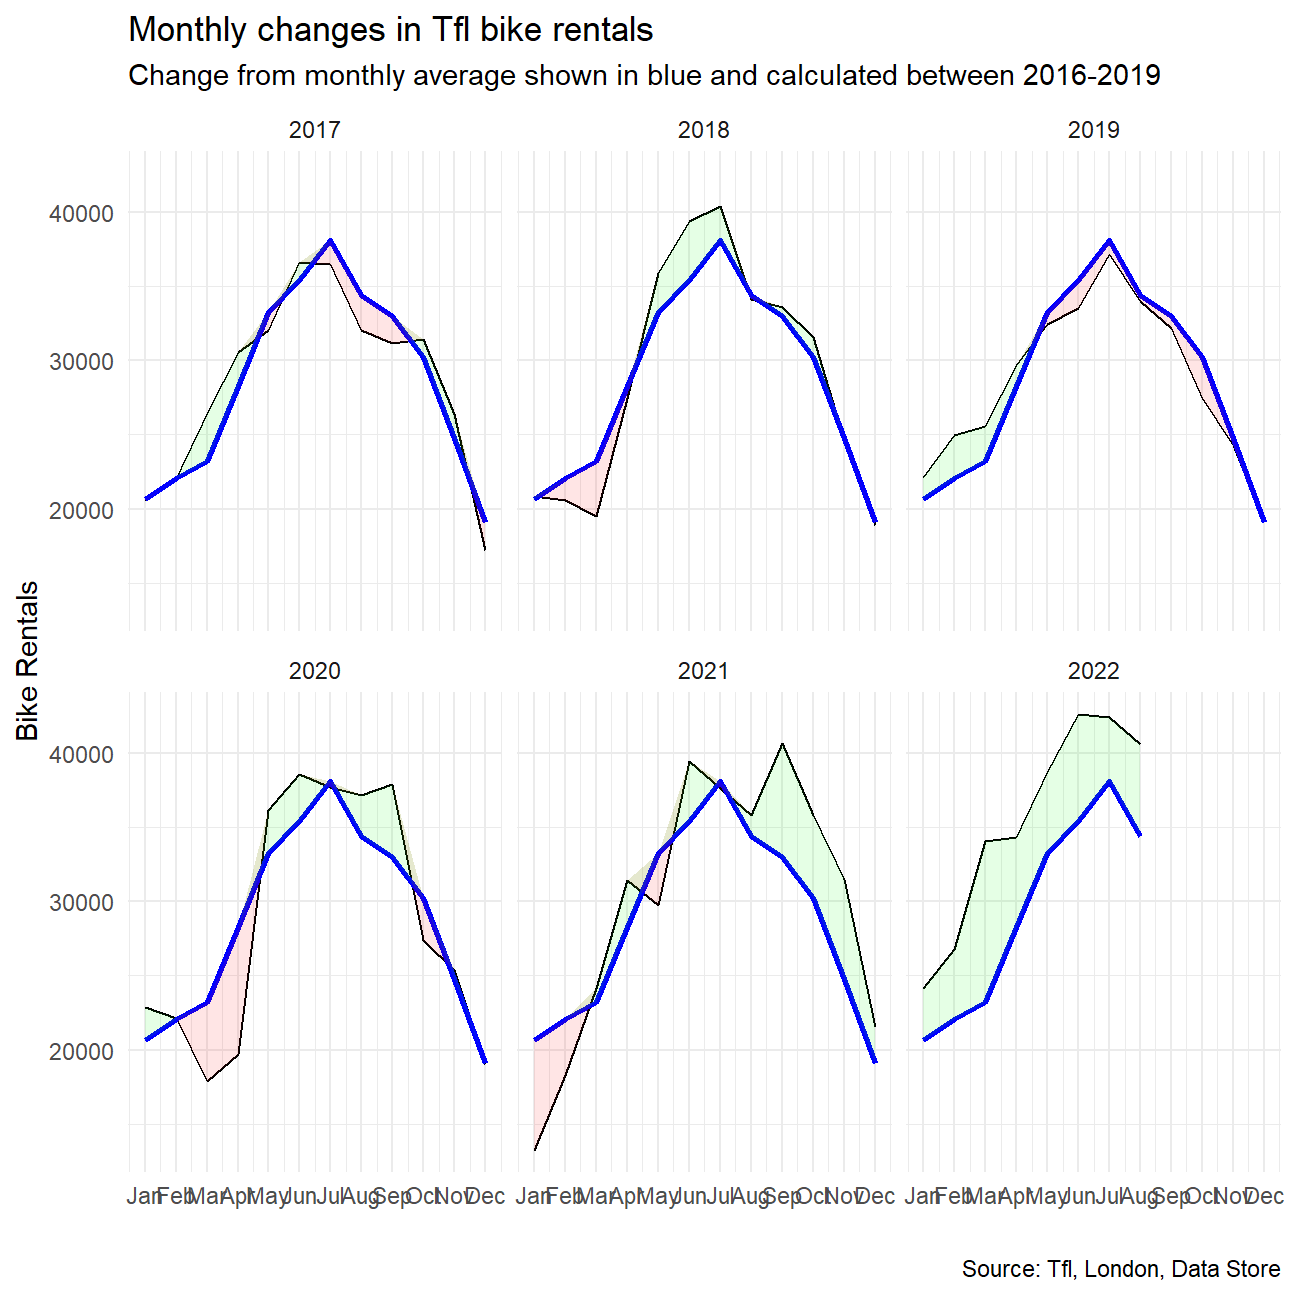
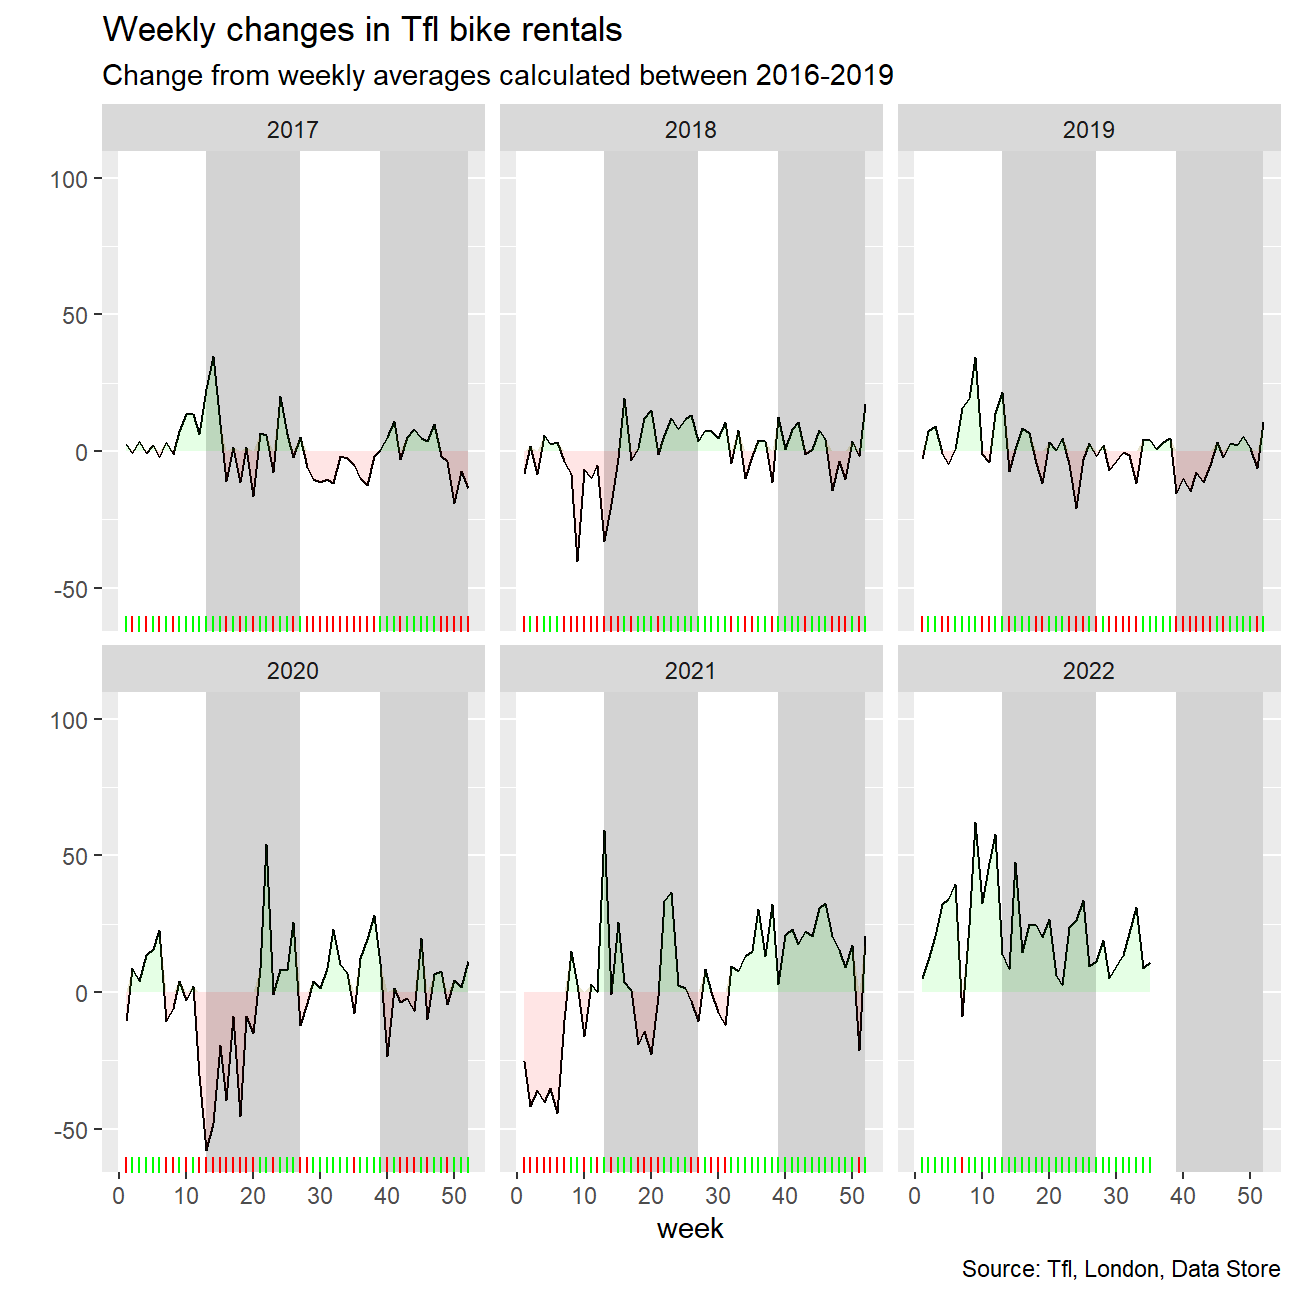
Weekly changes in TFL Bike rentals